Acoustic Scanner/Optical Televiewer & Sonic Log Interpretation – ASIMS
ASIMS was established in 2000 to provide high quality geotechnical data from downhole geophysical logs using specialised in-house techniques. Interpretation and analysis of acoustic scanner, optical televiewer and sonic logs provides geotechnical data from core and non-core drill holes for more effective coal and metalliferous mine planning, civil engineering, oil and gas extraction, and infrastructure development.
Our skilled Senior Geologists manually interpret the acoustic scanner and optical televiewer logs to identify only high confidence discontinuities. We have found that this is essential to obtain a rigorous geotechnical evaluation of the data.
Accurate and reliable defect identification, geotechnical set classification (bedding/ foliation, joints/ fractures, faults and caved/ crushed zones), calculation of joint set spacing, joint frequency, stress and rock strength provides geotechnical engineers with valuable in situ rock mechanics data, optimising design and development and improving safety.
ASIMS in-house techniques focuses on manual interpretation and set classification. Comparison case studies have shown that automatic picking software can miss critical defects such as joints and faults, may over pick sub-horizontal features and the resultant set classification can be deficient when compared to manual results. Our manual interpretation process ensures a robust database that substantially reduces costs and indicates zones of geological and geotechnical significance.
It is never too early to collect quality geotechnical data!
ASIMS offers two analysis reports, the Acoustic Scanner/Optical Televiewer Report and the Sonic Log Report, which may be combined or provided separately as required:
Acoustic Scanner/Optical Televiewer Report
Read more
What is the Acoustic Scanner?
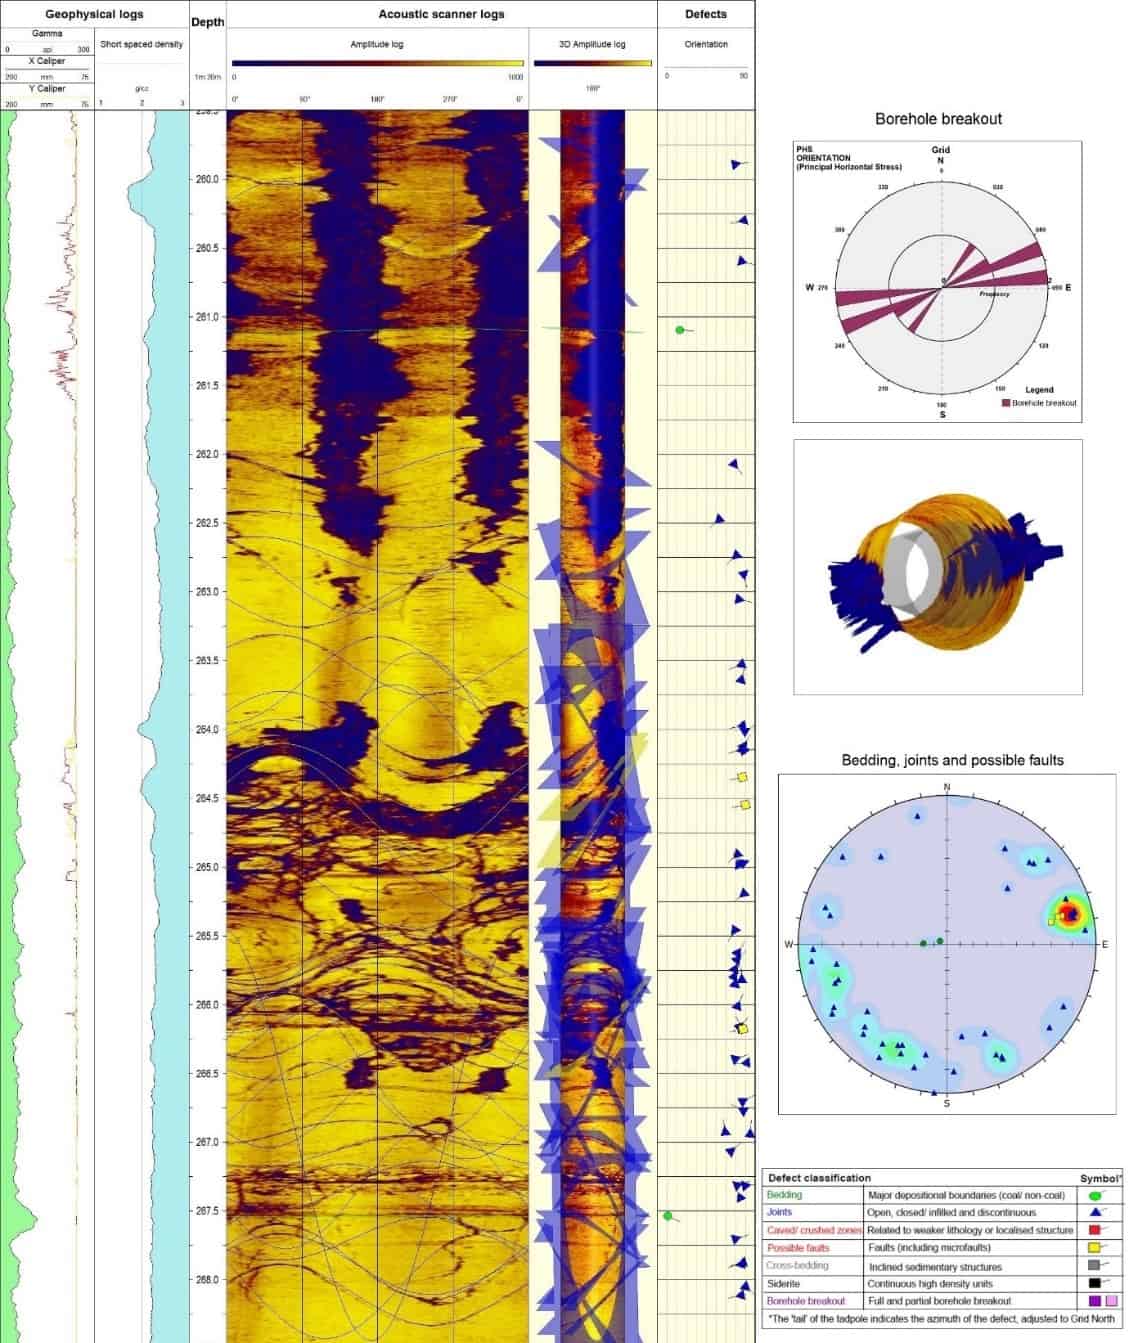
Sometimes referred to as the acoustic televiewer or ATV, the acoustic scanner is a geophysical downhole logging tool that generates a high resolution image of a drill hole wall by transmitting ultrasonic pulses and recording the amplitude and travel time of the reflected signals.
The amplitude of the reflected signal is a function of the rock properties of the drill hole wall. By interpreting the patterns of linear features in the reflected signal, it is possible to determine the orientation and type of discontinuities intersected by the hole.
The travel time of the reflected signal is a function of the shape of the drill hole wall, such that any wall failure is recorded, for example the characteristic lemon-shaped failure seen in the travel time log from borehole breakout, which can be used to interpret the direction of principal horizontal stress.
What is the Optical Televiewer?
The optical televiewer (also known as the OTV) is a downhole logging tool that generates a continuous orientated image of the drill hole wall using an optical imaging system. Changes in lithology, structural discontinuities and possible wall failure can be identified from the image.
The optical televiewer can be used in air or clean water, an advantage over the acoustic scanner, which can only be used in fluid filled holes. A limitation of this tool is that borehole breakout cannot be completely resolved as the shape of the drill hole wall cannot be precisely confirmed.
The Acoustic Scanner/Optical Televiewer Report
The report provides oriented defect data, important for open cut and underground mine planning and development:
Orientation data (dip/ dip direction/ strike) for bedding/ foliation, joints/ fractures, cleats, faults, caved/ crushed zones, major siderite bands and crossbedding
Borehole breakout, including principal horizontal stress direction (σ1)
Geotechnical set analysis and set spacing for bedding/ foliation, joints/ fractures, cleats, faults and caved/ crushed zones
Joint frequency calculation
Customised products such as RQD, aperture measurement and joint domain studies
Benefits of the report
Information on pit wall stability or optimal longwall orientation
Guidance for roof and rib support design and gas drainage
Increased understanding and confidence in the structural model
Presentation of joints identified from an acoustic scanner image. The joints have been categorised into geotechnical sets
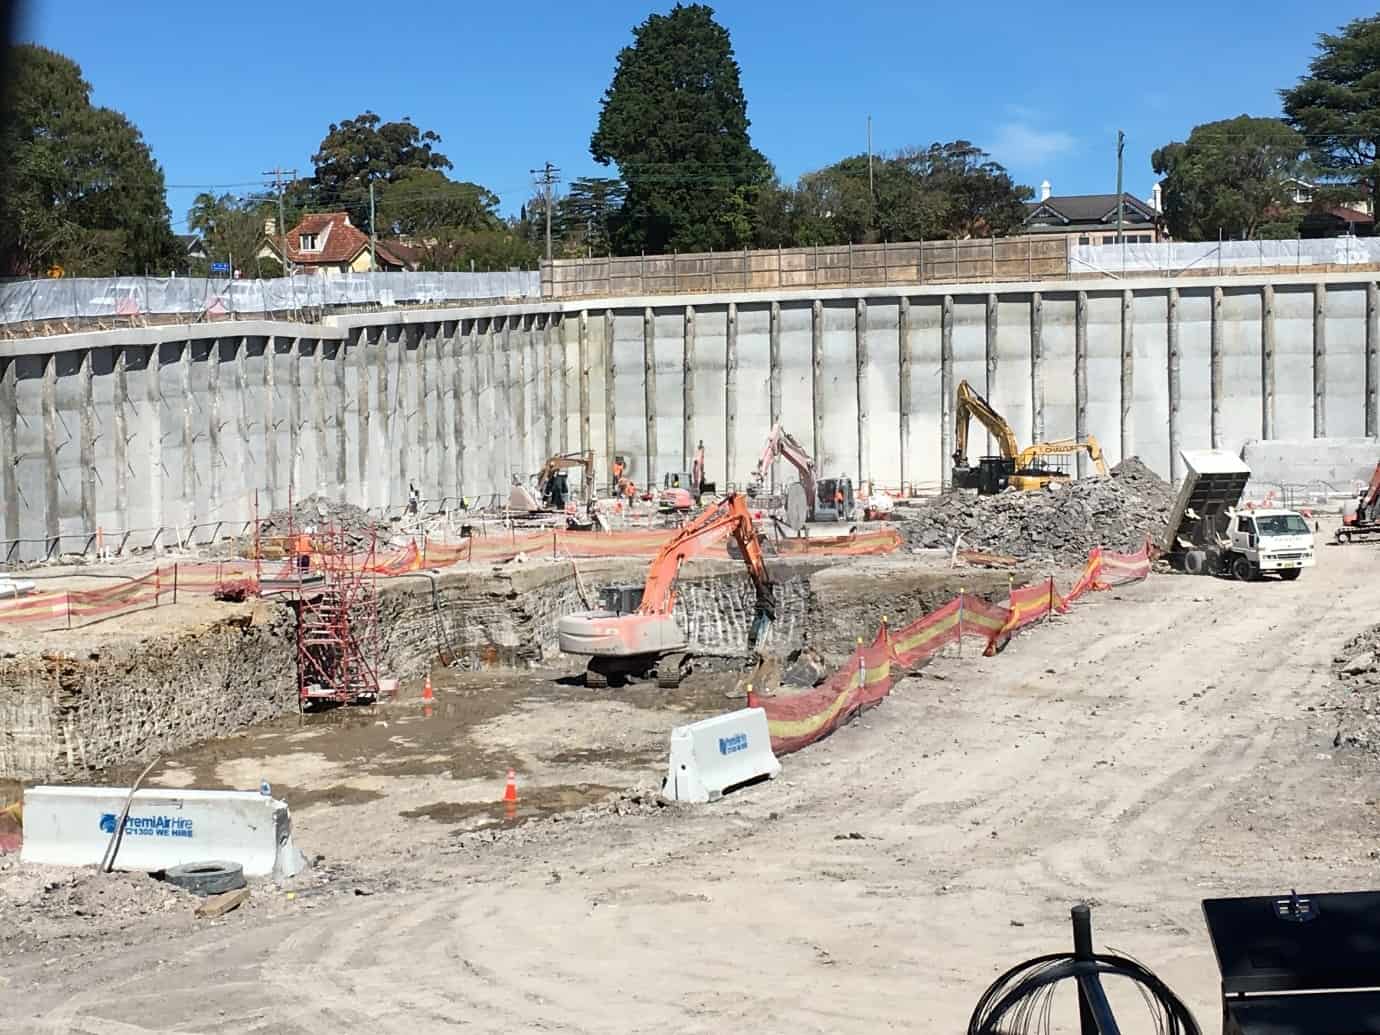
The Acoustic Scanner/Optical Televiewer Report– Civil/Infrastructure
ASIMS offers a report to meet the needs of civil engineering and geotechnical companies undertaking infrastructure projects such as roadways, tunnels, dams, bridges and other construction works.
The sonic log is a downhole geophysical logging tool that provides interval transit time for the rock formation which varies depending on lithology, rock texture and porosity. It is well known that the sonic log can be used to calculate Uniaxial Compressive Strength (UCS), and the log can also be manipulated to determine the Rock Strength Index.
How is the UCS estimated?
Numerous technical papers have shown that there is a statistically valid relationship between the sonic velocity recorded in water-filled boreholes and the UCS of corresponding core samples. There is a substantial amount of variability in the database, but experience has shown that a prediction based on the sonic log produces a useable estimate of strength. ASIMS uses an exponential relationship as a default. We can develop a site-specific relationship if required.
UCS has applications in surface mining operations such as:
assist in determining the performance of drill and blast operation
characterising the seam floor to identify areas of low strength that may impact on stability and to ensure the safe operation of equipment
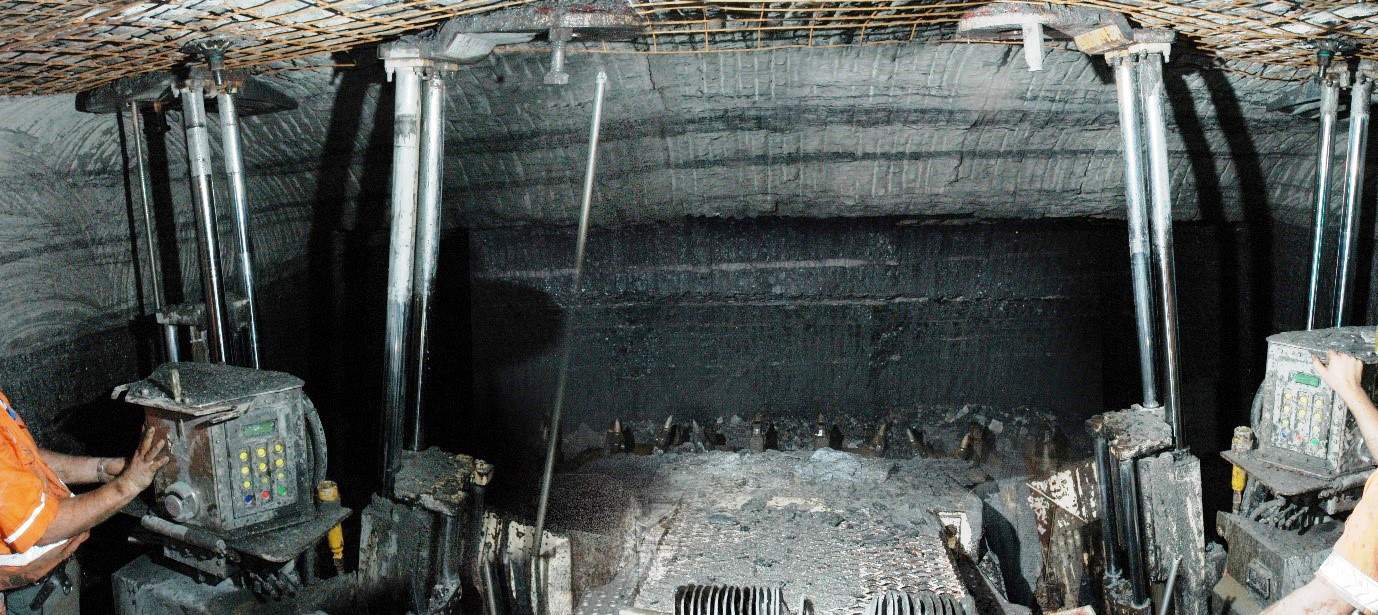
What is the Rock Strength Index?
The Rock Strength Index (RSI) is a measure that seeks to examine the performance of a rock mass by normalising the UCS of the rock to the estimated minor principal stress (typically the in situ vertical stress). It can be readily calculated from the density and sonic velocity geophysical logs obtained from any uncased drill hole. Low values of the RSI indicate more challenging geotechnical conditions. The RSI is an essential tool that can identify the critical zones in underground mines:
estimate the height of softening above mine roadways
a good predictor of the need for secondary roof support
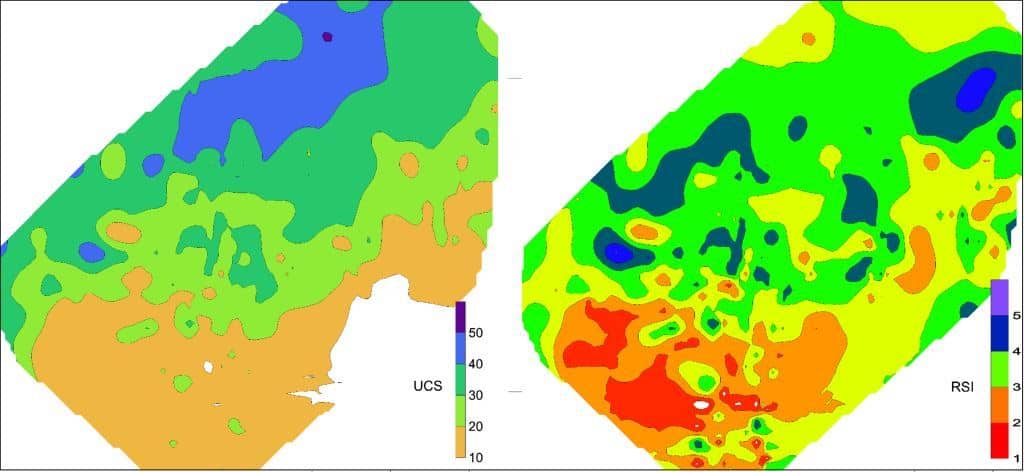
Estimated Uniaxial Compressive Strength (UCS) values for the entire drill hole and immediate roof and floor intervals of coal seams
Rock Strength Index (RSI) for immediate roof and floor intervals
Massive unit identification using sonic and gamma logs
Benefits of the report
Information to optimise roof support and roadway design
Assistance in planning if maps are prepared of the RSI over proposed mining area
RSI plots easily identify areas of more challenging geotechnical conditions
ASIMS have published and presented several technical papers focusing on the applications of acoustic scanner interpretation data and the analysed geotechnical sets. Click here to access publications